Through its real-time Forex trading platform, easyMarkets Australia offers complete suite of tool for Web, Desktop, Mobile and MT4 trading with 24 hours a day support and Dealing room service. In addition, easyMarkets provides One on One Forex training, The Trading School – Video on Demand trading lessons, and seminars.
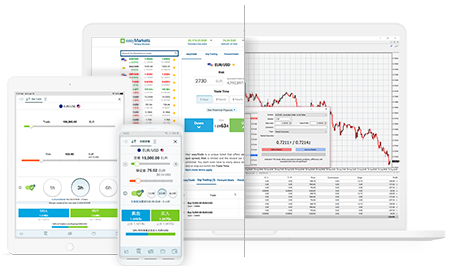
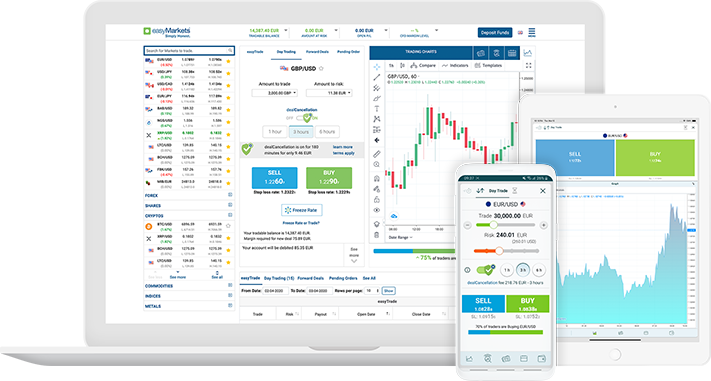
Trade forex, Commodities, Indices, Vanilla Options on Our New Trading Platform
WHY TRADE WITH easyMarkets?
- Unique dealCancellation feature
- Guaranteed Stop-Loss Rate
- Competitive spreads
- No commissions
- Online trading with Live, real time quotes
- No software downloads
- Start trading within minutes
- easyTrade for automatic hedging
View Current Promotion
Thinking of signing up and want to sweeten the deal? We understand that we win if you win, which is why we regularly create unique offers and promotions to deliver our traders the best experience. Click here to view our current promotions and offers to start your trading off with the boost you need. Some have a limited timeframe, so don't miss out!
Read More
Open a Live Account
Thinking of diving right in? Join the action by selecting and opening an account. easyMarkets account packages have no minimum balance required for opening, a signup process that takes just minutes, and no obligation to fund or trade. Experience the easyMarkets innovation advantage, by gaining access to our unique tools and trading conditions.
Start Trading
Open a Demo Account
New to trading? Find live trading intimidating? Perhaps you just want to test the waters and play around? If you are new, increase the scope for success by opening an easyMarkets demo account, and enjoy a simulated trading environment, so you can build your skills in a risk-free before you start trading. Get the training you need for smart trading.
Free Demo
Webinars & Events
Want to learn more about trading, macro-themes and the market? New to trading or a seasoned veteran, register for whichever FREE easyMarkets webinars you want. With two webinars put on at regular monthly intervals, easyMarkets is committed to making sure our clients are both educated and prepared for whatever market conditions may arise.
View Events
easyMarkets Trading - Instant Activation
Our innovative trading platform requires no installation and is available for trading instantly, with one of the quickest trading activation processes in the industry. Start trading in minutes today.
Open a demo account to try our features, or open a live account to start trading in minutes.
Accounts Comparison
We design trading accounts for you
At easyMarkets we don’t just offer you an account, we offer you a complete trading experience. Our benefits and conditions have been developed over almost two decades of experience and were designed to cover each of your individual needs.
standard
200+ AUD
Discover trading within minutes with this low level entry to get started. Experience our leading platform and get access to our exclusive trading tools.
- No Commission
- Competitive Spreads
- $50 dealCancellation Credit*
- FREE Guaranteed Stop Loss
- Negative Balance Protection
- 1st Trade Walkthrough
- Daily High Probability Trade Ideas
- Daily Analysis Access
premium
3,000+ AUD
Recommended
Experience a more serious trader level, which gives you access to professional trader capabilities and features.
- No Commission
- Tighter Spreads
- $500 dealCancellation Credit*
- FREE Guaranteed Stop Loss
- Negative Balance Protection
- 1st Trade Risk Free Walkthrough
- Personal Dedicated Dealer Access
- Premium Trade Ideas & Daily Analysis
VIP
10,000 + AUD
Receive the red carpet treatment with our institutional grade trading package. Access insider reports and trading conditions with all the VIP benefits.
- No Commission
- Institutional Spreads & Rolling Fees
- Up to $2000 dealCancellation Credit*
- FREE Guaranteed Stop Loss
- Negative Balance Protection
- Personal Dedicated Dealer
- Daily Investment Bank Trading Reports
- VIP Market-Mover SMS Alerts
- Absolutely No Slippage On large Sizes
What our Traders say about us
Offering our clients an exceptional customer experience since 2003
Reviews on
Best APAC Region Broker 2018
ADVFN International Financial Awards
easyMarkets is honored to be the recipient of the panel judged ADVFN Best APAC Broker award
Australian Regulated
AFSL 246566
easyMarkets Pty Ltd (AFSL 246566 ABN 73107184510) makes no recommendations as to the merits of any financial product referred to in this website, emails or its related websites and the information contained does not take into account your personal objectives, financial situation and needs. We recommend that you read the Regulation Page, The Product Disclosure Statement, the Client Agreement and the Financial Services Guide before making any decision concerning easyMarkets products.
2024 © easyMarkets Pty Ltd (formerly known as easy forex Pty Ltd) ABN 73 107 184 510 and is regulated by the Australian Securities and Investments Commission (ASIC).
Australian Financial Service (AFS) Licence No. 246566.
Target Market Determination – OTC Options
Target Market Determination – Forward Contracts
Target Market Determination – CFDs
Target Market Determination – easyTrade
easyMarkets Pty Ltd is part of the Blue Capital Markets Group (Blue Capital Markets Ltd is not regulated by ASIC).